技術・研究材料紹介(企業広告)
タンデム四重極質量分析計による高感度かつ高速な
ターゲットDESIイメージングによる薬物/代謝物の可視化と定量化
日本ウォーターズ株式会社
薬物動態研究における組織内薬物濃度測定では,一般的にLC-MS/MSが用いられるが,試料調整時に組織を均一化することにより化合物の分布情報は失われてしまう.一方,脱離エレクトロスプレーイオン化(DESI)質量分析イメージング(MSI)技術を用いることにより,放射性標識無しに化合物の分布情報を可視化および定量化が可能となる.本研究では,DESI MSIを用いたナルコレプシー治療薬であるピトリサントの薬効容量および毒性容量投与後の主要臓器における未変化体,主要代謝物および内因性代謝物の分布試験結果を示す.
Visualization and quantification of drug/metabolites by sensitive and fast targeted DESI imaging on TQ system
Emmanuelle Claude1, Ross Chawner1, Nathalie Delallée2, Stephanie Molez2, Gregory Nicolas2, Joanne Ballantyne1
1Waters Corporation, Wilmslow, UK; 2Bioprojet, Saint Gregoire, France
Introduction
Mass spectrometry (MS) coupled to liquid chromatography (LC) has been typically used for drug metabolism and pharmacokinetics (DMPK) studies. However, tissues are homogenized and therefore the molecular localization is lost.
Desorption electrospray ionization1 (DESI) mass spectrometry imaging (MSI) has proven to successfully map and independently quantify small molecules without radioactive labelling. Including small pharmaceutical molecules, as well as endogenous metabolites directly from tissue without the need of sample preparation after sectioning.
Tandem quadrupole (TQ) MS are renowned for their sensitivity and specificity in targeted applications using Multiple reaction monitoring (MRM) mode of acquisition.
Here, we used a commercial central nervous system (CNS) active drug named pitolisant that treats narcolepsy. It was dosed at pharmacological level and no observed adverse effect level (NOAEL) to show the distribution of the drug and its main metabolite in different organs such as liver and brain using the sensitive and fast DESI TQ system.
Method
Tissue sample preparation
Pitolisant, a drug enhancing brain activity histaminergic neurons, and its oxidized metabolite were dissolved in MeOH and diluted in 50:50 MeOH:H2O from 10 ng/ µL down to 0.05/ µL ng to establish the level of detection (LOD). 1 µL of each dilution series solution was spotted on control porcine liver tissue section.
Mice were dosed at a therapeutic dose of 5 mg/kg and NOAEL toxicologic dose of 75 mg/kg. Livers and brains were collected 2 hours after administration. Organs were immediately frozen in liquid nitrogen and stored at -80℃ until sectioning at 18 µm using a cryostat.
Mass spectrometry
MSI experiments were carried out using a Xevo™ TQ Absolute mass spectrometer with a DESI XS source (Figure 1), including the High-Performance sprayer (HPS) for improved sensitivity, spray focus, robustness and ease-of-use.
DESI spray conditions were set at 2 µl/min, 95:5 MeOH: H2O v/v and the N2 nebulising gas pressure was set at 10 psi. Capillary voltage was optimised for the most sensitive signal between 0.55 and 0.7 kV in positive ionisation mode. The samples were imaged at 15 and 50 µm pixel size.
MRM transitions were obtained from previous UHPLC MS/MS studies. They were transferred onto the DESI-XS source on the Xevo TQ Absolute mass spectrometer and optimised using pitolisant and its main metabolite in rodent (oxidized form) standards spotted onto liver tissue sections, running a confirmatory transition experiment.
MSI experiments were performed at different speeds, with various numbers of MRM transitions, with a minimum dwell time per MRM transition and pixel of 6 ms.
- a)HOW IT WORKS
- DESI operates by utilizing a nitrogen carrier gas to focus a jet of solvent at the surface of the sample, causing localized micro-extraction of molecules. The solvent is desorbed from the surface via a droplet pick-up mechanism, which is then deflected into the mass spectrometer for analysis.
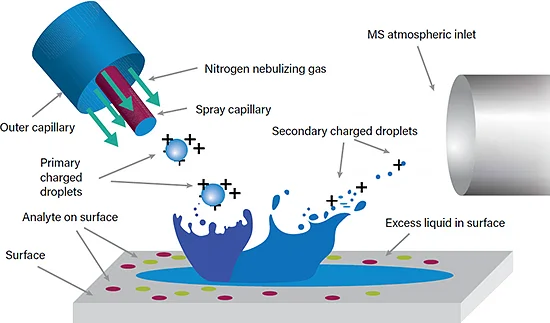
Takats et al. Science (2004)
b)
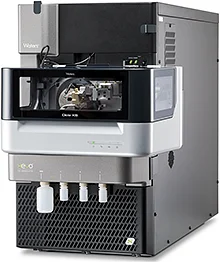

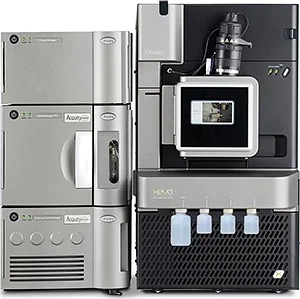
b) Xevo TQ Absolute mass spectrometer with ESI and DESI source.
Data management
DESI imaging datasets were mined using MassLynx™ software as well as processed and visualized using High Definition™ Imaging Software (HDI™) v1.8 (Waters).
An in-house quantitative MicroApp software called MSI Quantify was used to construct calibration curves mapping average signal intensities to known quantities or concentrations. These calibration curves were used to estimate an unknown amount of drug in dosed tissue of interest
Results
A) Dilution series to evaluate LODs of Pitolisant and its oxidized metabolite
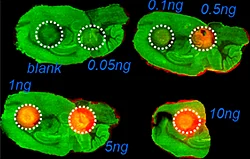
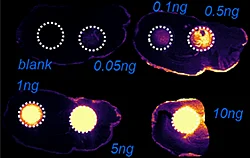
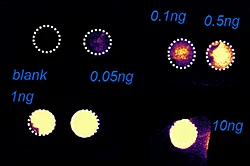
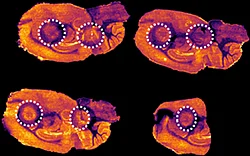
The first step of the workflow was to establish the level of detection (LOD) of the drug and its oxidized metabolite. The dilution series ranging from 0.05 to 10 ng was spotted on the control liver and brain tissue sections.
The best MRM transition for the pitolisant was m/z 296.2 > 98.1 and for the oxidized pitolisant was m/z 312.1 > 98.1.
| Control liver | Control brain |
|---|---|
|
(+)Pitolisant, m/z 296.2 > 98.05Lipid, m/z 798.55 > 163
|
(+)Pitolisant, m/z 296.2 > 98.05Lipid, m/z 798.55 > 163
|
|
(+)Pitolisant, m/z 296.2 > 98.05
|
(+)Pitolisant, m/z 296.2 > 98.05
|
|
(+)Pitolisant metabolite, m/z 312.1 > 98.05
|
(+)Pitolisant metabolite, m/z 312.1 > 98.05
|
|
(+)Lipid, m/z 798.55 > 98.05
|
(+)Lipid, m/z 798.55 > 98.05
|
Figure 2 displays the ion images of the dilution series of the drug, oxidized pitolisant and potassiated phospholipid PC [34:1] m/z 798.55 > 163 at 50Hz. Pitolisant was detected on liver and brain tissue section at 0.1 ng whereas the oxidized metabolite was detected at 0.05ng spotted on tissues.
B) Fast detection with high sensitivity experiments
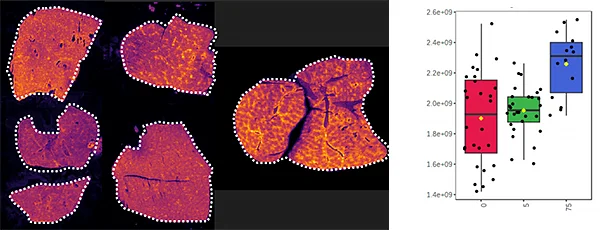
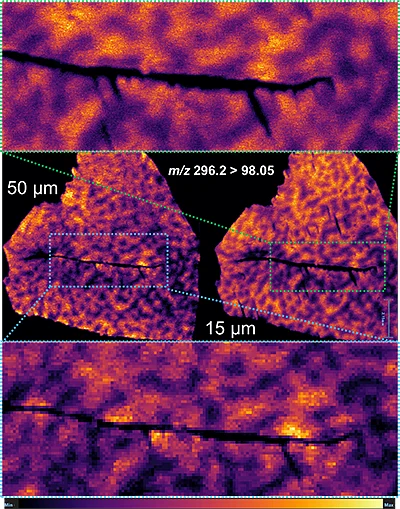
With the Xevo™ TQ Absolute mass spectrometer with a DESI XS source, it was possible to define two MRM transitions (m/z 296.2 > 98.1 and 798.55 > 163) and run the acquisition at 50 Hz acquisition speed and spatial resolution of 50 µm x 50 µm.
Overall the average acquisition time per tissue sections (control, 5 mg/kg and 75 mg/kg dosage) was 43 min the liver, as they were bigger than the brain tissue sections. Localization of pitolisant and potassiated PC [34:1] in control 5 and 75 mg/kg pitolisant dose liver tissue sections are shown in figure 3.
Furthermore, the detection of pitolisant was easily achieved from the pharmacological level dosed liver tissue section with a LOD > 10.
m/z 296.2 > 98.05 (max intensity 2,000,000)
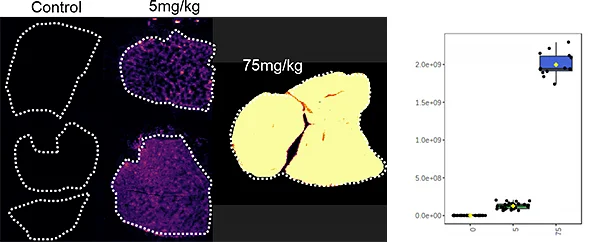
m/z 798.55 > 163 (max intensity 10,000,000)
C) Detection of drug, its oxidized metabolites and biomarkers
Further experiments were performed with ten MRM transitions defined at an acquisition speed of 10 Hz. Two MRM transitions were set for pitolisant m/z 296.2 > 98.05 and 296.2 > 126.15), one for the oxidized metabolite (312.1 > 98.05) and seven MRM transitions for lipids: PC [32:0], K+ m/z 772.55 > 163; PC [34:1],Na+ m/z 782.55 > 147; PC[36:2],H+ m/z 782.55 > 184; PC[34:1],K+ m/z 798.55 > 163; PC[36:1],Na+ m/z 810.6 > 147; PC[36:4],K+ m/z 820.6 > 163; PC[38:4],K+ m/z 848.6 > 163.
| Liver tissue sections | Brain tissue sections |
|---|---|
|
(+)m/z 296.2 > 98.05 (max intensity 900,000)
|
(+)m/z 296.2 > 98.05 (max intensity 500,000)
|
|
(+)m/z 312.1 > 98.05 (max intensity 300,000)
|
(+)m/z 312.1 > 98.05 (max intensity 300,000)
|
RGB overlay m/z 296.2 > 98.05 vs. m/z 312.1 > 98.05
  |
|
|
(+)m/z 772.55 > 163 (max intensity 400,000)
|
(+)m/z 772.55 > 163 (max intensity 3,500,000)
|
|
(+)m/z 782.55 > 147 (max intensity 900,000)
|
(+)m/z 782.55 > 147 (max intensity 3,000,000)
|
|
(+)m/z 786.55 > 184 (max intensity 350,000)
|
(+)m/z 786.55 > 184 (max intensity 900,000)
|
|
(+)m/z 798.55 > 163 (max intensity 2,000,000)
|
(+)m/z 798.55 > 163 (max intensity 6,000,000)
|
|
(+)m/z 810.55 > 147 (max intensity 100,000)
|
(+)m/z 810.55 > 147 (max intensity 400,000)
|
|
(+)m/z 820.6 > 163 (max intensity 1,500,000)
|
(+)m/z 820.6 > 163 (max intensity 1,500,000)
|
|
(+)m/z 848.6 > 163 (max intensity 500,000)
|
(+)m/z 848.6 > 163 (max intensity 1,000,000)
|
Figure 4 displays the ion images from the 10 MRM transitions for the 5 mg/kg and 75 mg/kg doses mouse liver and brain tissue sections.
Interestingly, it can be seen from the RGB overlay ion images of the pitolisant and oxidized metabolite that they have similar distributions in liver and brain at high dose. This confirms the known high tissue distribution2. Whereas, at pharmacological dose, they have different intra tissular distributions, especially in the liver, where pitolisant is more abundant around the lobule and the metabolite is more ubiquitous.
Table 1 shows the summary of the S/N calculated from the raw data acquired from the two dosed liver and brain tissue section.
Overall, the drug and its main metabolite were detected with a good S/N > 10 at pharmacological dose, even in the brain, where both have passed through the blood brain barrier.
| Signal to noise (S/N) | ||||
|---|---|---|---|---|
| Liver | Brain | |||
| 5 mg/kg | 75 mg/kg | 5 mg/kg | 75 mg/kg | |
| Pitolisant | 39 | 180 | 10 | 250 |
| Oxidized metabolite | 14 | 57 | 12 | 171 |
D) Enabling relative quantification
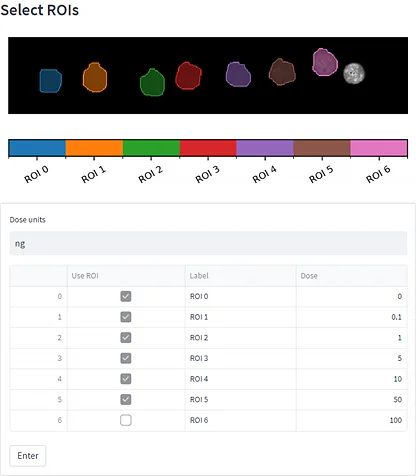
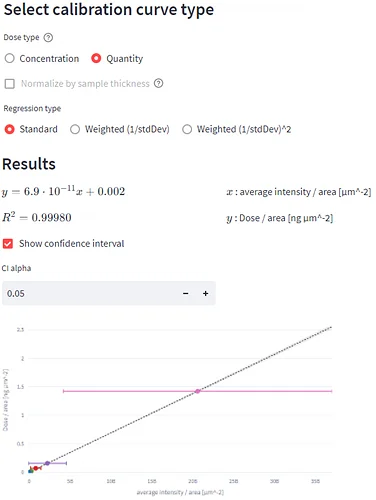
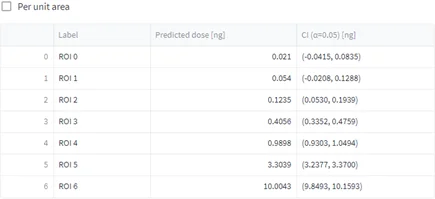
The dilution series with the MRM dataset processed using HDI software was used to generate the calibration curves for pitolisant in MSI Quantify MicroApp.
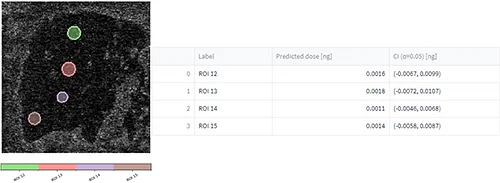
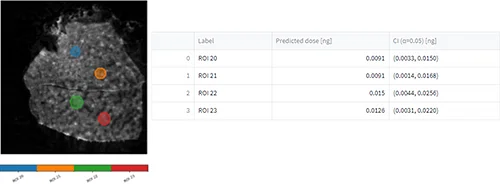
After uploading the dilution series dataset, a m/z of interest was selected, ROIs were drawn (figure 6, A), concentration/quantities were specified, calibration curves were generated (figure 6, B) and evaluation of the calibration curve was conducted against the dilution series dataset itself (figure 6, C).
Tissue imaging processed datasets were also uploaded and ROIs were drawn on them. Predicted doses were calculated for each ROI from the control, pharmacological and NOAEL dosed liver tissue section (figure 6, C).

Conclusion
- Pitolisant and its metabolites were detected sub 0.1 ng when spotted onto tissue section, demonstrating the high sensitivity and specificity of targeted MRM MS Imaging workflow.
- A highly flexibility workflow is evidenced allowing high speed DESI MSI experiments with no compromise in sensitivity or including more MRM transitions to map biomarkers as well as drug.
- Pitolisant and its oxidized metabolite were easily detected at pharmacological dose, illustrating the different distributions in the liver and brain murine tissue sections, information that wouldn’t be discovered by traditional DMPK studies.
- MSI quantification workflow is demonstrated with the in-house MicroApp MSI Quantify.
Reference
- Z.Takats et al.; Science, Vol306, 15 Oct 2004
- X.Ligneau et al.; Biochemical Pharmacology, Volume 73, Issue 8, 15 April 2007.


